NOISeq (Differential Expression in RNA-seq)
Install packages
- NOISeq in R
# Location of packages download
source("http://bioconductor.org/biocLite.R")

# Download packages
biocLite("NOISeq")

#Use packages in R
library("NOISeq")
Several parameters
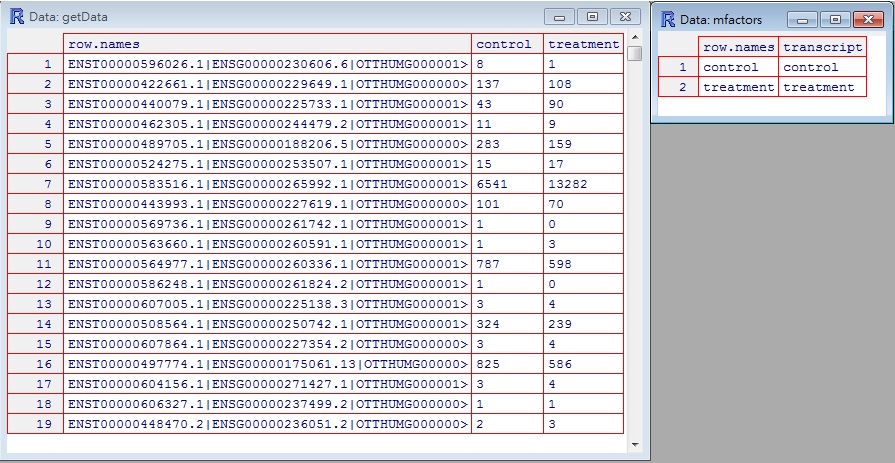
Before executing NOISeq, the first thing is to set raw data in the format recognized by NOISeq. The following would provide a example with several images. There are two tables , factors and input data , that NOISeq utilities would check as constraints.
- input data : One row represents one sample data, e.g. gene_1, gene_2, gene_3 with different conditions. For example, row name is gene name and column are different conditions, control or treatment. (refer to the left part of the bottom image)
- factors : The factor tries to recognize what conditions you are planning to analyze. So, row names in the factor table represent conditions in input data. Columns in factor table are items that you try to summary and analyze. The element in the factor table represents the meaning in this anlaysis. (refer to the right part of the bottom image)
k: The value is used to replace the value "0" with k in order to avoid too small normalized value, "Inf".
norm: The normalization method for total samples and there are four ones, "rpkm" (default), "uqua" (upper quartile), "tmm" (trimmed mean of M) and "n" (no normalization).
replicates:The input contained what kinds of data, there are "technical", "biological" and "no" three options.
pnr: The percentage of total data is used to "simulated" each sample when there are no replicate. By default, pnr was 0.2.
nss: Number of samples simulates each condition. By default, nss = 5 (nss >= 2).
Commands
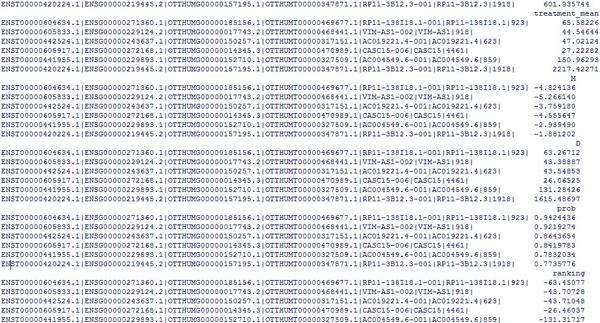
- The following is the simple example. (Dataset is the same with the above figure.)
# read data
getData <- read.table("combine.txt",header=T)
seqName <- getData[,1]
getData <- getData[2:3]
rownames(getData) <- seqName

# NOISeq analysis
source("http://bioconductor.org/biocLite.R")
biocLite("NOISeq")
library("NOISeq")

mfactors <- matrix(c("control","treatment"),nrow = 2, ncol = 1, byrow = TRUE,
dimnames = list(c("control","treatment"),c("transcript")))

mydata <- readData(data=getData, factors=mfactors)
getNOIseqRes <- noiseq(mydata, k = 0.1, norm = "uqua", replicates = "no", factor="transcript", pnr = 0.2, nss = 10)

write.table(getNOIseqRes@results[[1]], file="afterNoiseq.txt", sep="\t", row.names=T, col.names=T, quote=F)
- First, the head four lines were trying to reset the data format in order to fit input data mentioned above.
- Next, use source and biocLite to locate and download the NOIseq packages. Use NOISeq packages must be imported from the outer source by R command library.
- The "mfactors" was also tried to reset the format in order to make NOISeq understand the item for further analyses.
- The variable "getNOISeqRes" was stored the result executing the noiseq execution.
- The " getNOIseqRes@results[[1]] " was tried to extract all normalized data from NOISeq calculation, not only partial data whose probabilities are the highest.
Results
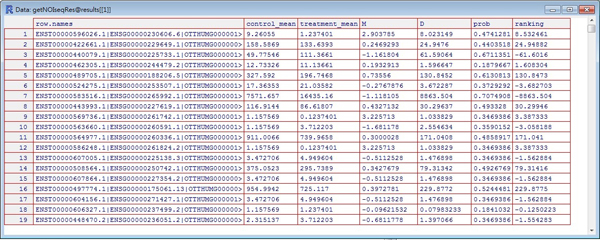
- The partial result showing the highest probabilities by default. The more probabilities, the more significant difference between two conditions.
- The complete result could be extracted by the @result[[1]], and these are good resource for further analyses.
Several special parameters on the output
- M (fold change): log2(expression in condition.1 / expression in condition.2)
- D (expression difference): | expression in condition.1 - expression in condition.2 |
References
- Official document of NOISeq in R.