Transcription start site prediction by identifying CpG islands
Transcription & its regulation
RNA polymerase II is responsible for transcription of gene-coding genes. Transcription factors give a hand for the initiation of RNA polymerase II transcription.
There are two kinds of initiation factors, general and specific factors. The general transcription factors would help for initial transcription of all protein genes. The specific ones are involved in a subset of genes, even more a single gene. Such one may either enhance or repress gene expression.
The DNA molecules in linear form are too long to stay in the nucleus. The compaction is needed for the DNA molecules. With the aids of histone proteins DNA molecules could be packed into nucleosomes by some mechanisms. We refer to a complex of proteins and DNA molecules in the nucleus of a eukaryotic as chromatin .
The chromatin in highly condensed form is called heterochromatin and may be tend to turn off gene expression. The transcription efficiency is partly determined by chromatin structure.
The packing of DNA and chromatin structure are dynamic. Chromatin structure is controlled by lots of enzymatic activities. For example, the histone could be modified by acetylation, methylation, phosphorylation and ubiquitylation. One example is that the acetylation of lysines in N-terminal tails of histones may contribute to open up chromatin structure and further enhance gene expression.
DNA sequences influence transcription activities
However, does DNA sequence affect transcription activities? In general there are two kinds of sequences contributing to transcription activities, general sequences and specific sequences associated with a subset of genes .
In the case of the gene-specific transcription factor, there are many examples that these proteins recognize specific sequence elements in region at upstream of the transcription start site. The oestrogen receptor is one of famous examples that it recognize a sequence AGGTCANNNTGACCT (N could be A, T, C, G) and these sequences are referred to oestrogen response element.
On the other hand, if we want to identify transcription start site of all genes is any general sequence recognized by general transcription factors? The 'TATA box' is a good example that it could be recognized by TATA-binding protein. This 'TATA-binding protein' is a subunit of general transcription factor, TFIID. About 10~20% of all human genes have a recognizable TATA box in front of transcription start site. This 'TATA box' could be a character for identifying transcription start site in computational.
CpG islands
Another common feature of transcription region is CpG islands . These regions are close to the transcription start site of 60%~70% of all human genes.
The frequency of CpG islands is much higher than the background frequency of this dinucleotide. In vertebrate genomes CpG islands are very rare. Because the C in CpG dinucleotide is frequently methylated. Over evolutionary time methylated C in CpG sequences may be spontaneous converted into T as TpG dinucleotide. But CpG islands at the regions near transcription start sites tend not to be methylated, and this may cause less replacement of CpG to TpG.
Such methylation of nucleotide C in CpG dinucleotide is processed by DNA methyltransferase and always turns gene expressions off.
In clinical the aberrant methylation of CpG islands near the transcription start sites of tumor suppressor genes may contribute to cancer development.
CpG sites are good examples for epigenetic inheritance that methylation information could be passed on to next generation. Such epigenetic inheritance includes repression of a subset of genes and patterns of histone modifications.
In human genome the DNA methyltransferase would work on unmethylated CpG dinucleotide whose opposite dinucleotide is methylated and result in pairwise methylation.
DNA methylation is also an important basis for genomic imprinting in cell development, the phenomenon that a gene may be differently expressed relied on the origin from maternal or paternal.
Finding CpG islands with Perl & R script
CpG islands prediction following Takai and Jones method[2]
- The total length of the CpG island is larger than 500 nucleotides.
- The content of G + C is at least 55%.
- The ratio between the frequency of observed CpG sites and the frequency of expected CpG sites should be at least 0.65. The following figure is the formula for this ratio.
$$\frac{Observed}{Expected} = \frac{f{CpG}}{f{C} f_{G}} = \frac{S N{C{p}G}}{N{C} * N{G}}$$- S : Sequence length
- f : frequency
- N : counts
The following is Perl script to identify the CpG islands in the DNA sequence.
#!/usr/bin/perl

use strict;

# global variables
my $fName = "short.fa";
#my $fName = "chr4_region.fa";
my $seq = "";
my $winSize = 500;
my $stepSize = 10;

# get total sequence
open(fin,$fName) or die("Error: Input file error.\n");

foreach my $line () {
    chomp($line);
    unless($line =~ m/^>/) {
        $seq .= $line;
    }
}

close(fin);

# start to predict the pattern
print "pos\tcpg\tcg_ratio\tcg_obs_exp\n";
for(my $i = 0; $i < length($seq)-$winSize+1; $i = $i + $stepSize) {
    my $partSeq = substr($seq,$i,500);
    my $C = ($partSeq =~ s/C/C/g);
    my $G = ($partSeq =~ s/G/G/g);
    my $CG = ($partSeq =~ s/CG/CG/g);
    my $CG_ratio = ($C + $G) / $winSize;
    my $CG_obs_exp = ($CG * $winSize) / ($C * $G);
    my $pos = $i + $winSize/2;

    # use 1 and 0 to indicate whether it is CpG island or not
    if(($CG_ratio >= 0.55) && ($CG_obs_exp >= 0.65)) {
        print "$pos\t1\t$CG_ratio\t$CG_obs_exp\n";
    }
    else {
        print "$pos\t0\t$CG_ratio\t$CG_obs_exp\n";
    }
}
- The following R script is to show the potential CpG islands from the result of Perl script.
# get the result from the execution of Perl script
getData <- read.table("cpgRes.txt",sep="\t",header=T)
getCpg <- getData[,2]
getRatio <- getData[,3]
getExp <- getData[,4]
# start to plot
xRange <- c(getData[1,1]-50,getData[nrow(getData),1]+50)
yRange <- c(min(getRatio,getExp)-0.1,max(getRatio,getExp)+0.1)
xLabel <- "Pos"
yLabel <- "Ratio"
plot(0,type="n",ylim=yRange,xlim=xRange,xlab=xLabel,ylab=yLabel)
# draw potential CpG islands
for(i in 1:nrow(getData)) {
if(getCpg[i] == 1) {
print(i);
dx <- c(getData[i,1],getData[i,1])
dy <- yRange
lines(dx,dy,col="green",lw=2)
}
}
# draw CG ratio
for(i in 1:nrow(getData)) {
dx <- c(getData[i,1],getData[i+1,1])
dy <- c(getRatio[i],getRatio[i+1])
lines(dx,dy,col="red",lw=2)
}
# draw CG obv/exp ratio
for(i in 1:nrow(getData)) {
dx <- c(getData[i,1],getData[i+1,1])
dy <- c(getExp[i],getExp[i+1])
lines(dx,dy,col="blue",lw=2)
}
# add text
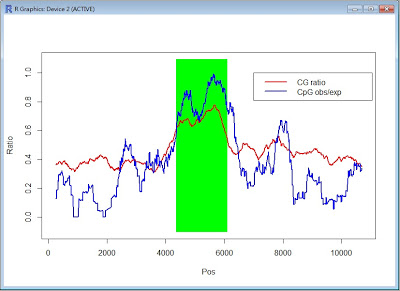
legend(7000, 1.0, c("CG ratio", "CpG obs/exp"), col = c("red", "blue"), lwd = 2)
- The following figure is the result from continuously executing Perl and R script.
Reference
- Genomics and Bioinformatics, Tore Samuelsson, Cambridge university press, July 2012, ISBN: 9781107401242
- Takai D. and P. A. Jones (2002). Comprehensive analysis of CpG islands in human chromosomes 21 and 22. Proc Natl Acad sci USA 99(6), 3470-3475