PSI-BLAST
- A function to every gene: Coagulation factor, Protein domain analysis, PSI-BLAST
Royal disease
The son, Alexei, of the tsar of all Russians, Nicholas II, is a well-known example of haemophilia disease. One of the clinical characters to the haemophilia is hard-to-stop bleeding.
The haemophilia could be divided into three subtypes;
- haemophilia A: a deficiency in the activity of coagulation factor VIII
- haemophilia B (Christmas disease): a deficiency of factor IX
- von willebrand disease: a deficiency of protein von willebrand factor
Both the type A and type B are X-linked disorders.
Because of the aftermath of Russian revolution and the recent gene technology the gene of the whole family of the tsar Nicholas II could be reexamine. The result showed that Alexei suffered from the haemophilia B and this heredity deficiency gene could be traced back to his grandmother, Queen Victoria of England.
Haemophilia B is a fatal point mutation in the factor IX gene altering the RNA splicing and leading to production of a truncated form of factor IX.
Blood-clotting pathways
- The process of the formation of blood-clotting could be separated into intrinsic and extrinsic pathway (refer to the following figure) .
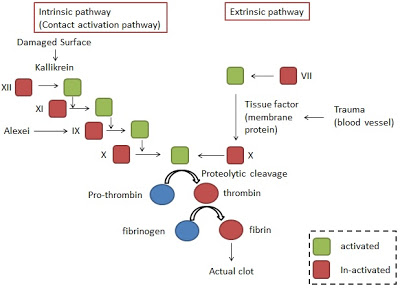
The most important pathway for initiating clot formation is the extrinsic pathway. Based on the pathways thrombin converts fibrinogen into fibrin responsible for forming the actual clot.
Blood coagulation is one example of enzymatic cascade which at each stage a molecular signal is amplified. And this may contribute to the early and quick response to the trauma even though the initial signal may be weaker.
The intrinsic and extrinsic pathway are biological related and the enzyme of both is proteolytic activity. Further there are other properties in common among them on the basis of analysis of their sequences and protein domain structures. These suggest that they may be related by evolution and may be thanks to the gene duplication events.
Protein domain architecture
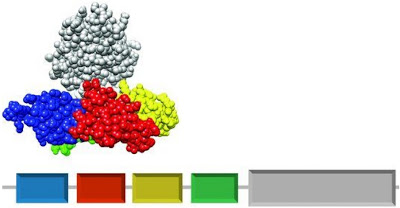
- Take coagulation factor XI as an example referred to the following figure[1] this factor consists of four PAN domains (with multi-color) and one serine-protease domain (with gray color). Each domain contributes distant functions, for instance, the serine-protease is the major component for catalytic activity to protein factor IX in the intrinsic pathway of blood-clotting. The inactive structure of factor XI is similar with a set of a "cup" with a "saucer". And these four domains are encoded in the same polypeptide chain in a linear manner.
- We could regard the domain architecture of a protein as the sequence of protein doamin. How do the protein domain architectures come about during the evolution? An important mechanism of protein gene evolution is chromosomal rearrangement.
Bioinformatics of protein domains
How to elucidate the domain structure in the basis of amino acid sequence without the 3D structure of protein? We could use different and well-defined protein domains as queries in BLAST searches to identify homologous domain in a set of sequences present in databases.
But the truth is that BLAST search is often not sensitive enough to identify the evolutionary relationship between two homologous sequences. The reason might be that the amino acid in the protein is possible to be changed, so that the same 3D structure or biological function of a protein could be derived from different amino acid sequences. Therefore, protein sequences may as little as about 10% of sequence identity.
There are two methods based on the profiles (or position-specific scoring matrices, PSSMs) to deal with the identification of protein homology, that are PSI-BLAST and HMMER. In such methods a statistical model of in evolutionary related protein sequences is created on the basis of multiple alignment of sequences. For example, the 20 amino acid for the proteins as following figure
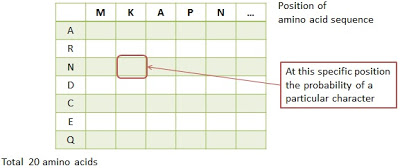
The important application of a protein profile is that we could find more potentially related with structure or function of sequences relied on the profiles against the databases.
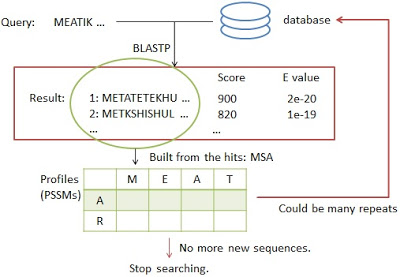
PSI-BLAST was developed in 1997. The following figure is the process of the PSI-BLAST.
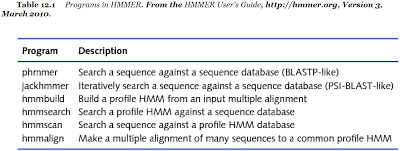
The HMMER developed in 1998 ny Sean Eddy is another example using the profiles to further analyze the protein sequences. This method is implemented by profile hidden Markov models (profile HMMs) which have a formal probabilistic basis. The following is the list of the function in the HMMER packages.
The famous database Pfam is one of the largest collection of protein families. It collects protein multiple alignments and their corresponding profile HMMs. Pfam consists of two parts, Pfam-A and Pfam-B. Each of Pfam-A families corresponds to a structural and functional domain of a protein. We could take the protein factor XI as a input through the pfam programs and the result may show four parts of domain known.
Bioinformatic analysis of blood-clotting proteins
Try to examine a set of 14 proteins related to coagulation through the HMMER package. The sequences of 14 proteins were collected from Swiss-Prot/UniProt and stored into a file named clotting.fa.
download and install HMMER packages (on CentOS environment):
- download the package from http://hmmer.janelia.org/software.
- $ tar zxf ./hmmer-3.1b1.tar.gz
- $ ./configure
- $ make
- $ make check
Usage of HMMER programs (on CentOS environment):
- $ hmmpress ./Pfam-A.hmm # hmmpress is located on the folder named binaries, Pfam-A.hmm downloaded from Pfam website
- $ hmmscan --domtblout clotting.tab ./Pfam-A.hmm ./clotting.fa
The important functions in the HMMER packages as the following image:
- The partial clotting.tab showed on the following figure. There are several information as following:
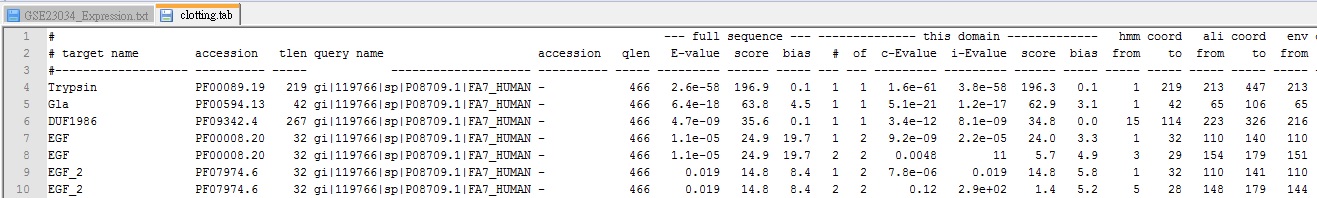
- Pfam family name and its length
- query sequence name and its length
- domain e-value (independent e-value)
- the start and end position of the query sequence in alignment
Perl script: summarize the result of hmmscan in HMMER
Try to summarize domain information of the query sequence and the result further as the input for R script for imaging.
Requirement:
- Input: clotting.tab
- Output: parse_hmmscan.out
- domain information extraction: $ perl ./P1.pl > parse_hmmscan.out
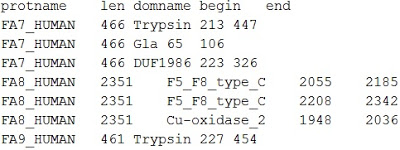
- Data: (1)protein name (protname); (2)length (len); (3)domain name (domname); (4)sequence begin (begin) & end (end) position
The following figure is the partial result of the file named parse_hmmscan.out
- The following is the Perl script to extract the information for the input of R script:
#!/usr/bin/perl -w

use strict;

open(fin,"clotting.tab") or die("Input file error.\n");

print "protName\tlen\tdomName\tbegin\tend\n";
while () {
    # avoid the comment line
    unless (m/^\#/) {
        # combine the regular expression into the split function
        # when using regular expression with split, the target might be $_(the default variable)
        my @columns = split(/ +/);
        my $protName = $columns[3];
        $protName =~ s/.*\|//;
        my $len = $columns[5];
        my $domName = $columns[0];
        my $begin = $columns[17];
        my $end = $columns[18];

        my $evalue = $columns[12];
        if ($evalue < 1e-5) {
            print "$protname\t$len\t$domname\t$begin\t$end\n";
        }
    }
}

close(fin);
R script: transform the parse_hmmscan.out into protein domain sequence in the linear format
- The following figure is the combination result transforming the domain data into the image in the linear format.
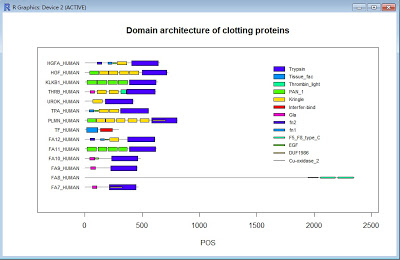
- The following is the R script to achieve the above result in image:
# get the data from hmmscan
data <- read.table("parse_hmmscan.out", sep='\t', header = T)

# get the max length of the domain sequence for plotting
maxlen <- max(data$len)

# identify the total number of proteins
# equal to "length(unique(data$protname))"
prots <- length(levels(data$protname))

# new blank drawing with several parameters
mainTopic <- "Domain architecture of clotting proteins"
plot(0, type='n', xlim=c(-300,maxlen+100), ylim=c(0,prots+2), xlab="position", ylab="", yaxt = "n", main=mainTopic)

# start to draw the image
prevname <- ""                # save the previous sequence name for identifying whether this name is the same with it
y <- 1                    # count total number of different proteins
palette(rainbow(7))            # get palette for 7 kinds of color, rainbow for creating the continuous colors
width <- 0.02                 # the width unit of the rectangle
lines <- length(data$protname)        # get all the sequence needed to be drawn

# draw body
for (i in (1:lines)) {
    test <- data$protname[i]    # each time to get the name of only one target

    # the previous information to be printed
    if(test != prevname) {
        y <- y + 1

        # print the protein name at y axis
        text(-10, y, data$protname[i], cex = 0.7, pos = 2)

        # draw line corresponding to the protein lengths
        # lines(c(x axis position), c(y axis position), ...)
        lines(c(1, data$len[i]), c(y,y), col = "grey", lw = 2)
    }

    # start to draw domain for each proteins
    prevname <- test

    # calculate the total number of the unique domain
    domlen <- length(levels(data$domname))

    # draw domain in the rectangle format
    # draw the same domain with the same color
    # search each domains for each proteins
    # the color dependent on the protein order
    for (j in (1:domlen)) {
        if (levels(data$domname)[j] == data$domname[i]) {
            color <- j
        }
    }
    rectBottom <- y - width * color
    rectTop <- y + width * color

    # rect(xleft, ybottom, xright, ytop, ...), counter-circle
    rect(data$begin[i], rectBottom, data$end[i], rectTop, col=color)
}

# add the explaination for the domain information
x <- maxlen * 0.7
for (i in (1:domlen)) {
    pos <- 4 + i * 0.8
    rect(x, pos - 0.02 * i, x + 100, pos + 0.02 * i, col = i)
    text(x + 100, pos, levels(data$domname)[i], pos = 4, cex = 0.7)
}
Reference
- Genomics and Bioinformatics。Tore Samuelsson。Cambridge university press。July 2012。ISBN: 9781107401242。