K means
K means in R
library("stats")
require(graphics)
firstData <- matrix(rnorm(100, sd = 0.3), ncol = 2)
secondData <- matrix(rnorm(100, mean = 1, sd = 0.3), ncol = 2)
combineData <- rbind(firstData,secondData)
colnames(combineData) <- c("1st", "2nd")
clusterRes <- kmeans(combineData, centers=2)
clusterRes <- clusterRes$cluster
plot(combineData, col = clusterRes$cluster)
points(clusterRes$centers, col = 1:2, pch = 8, cex = 2)
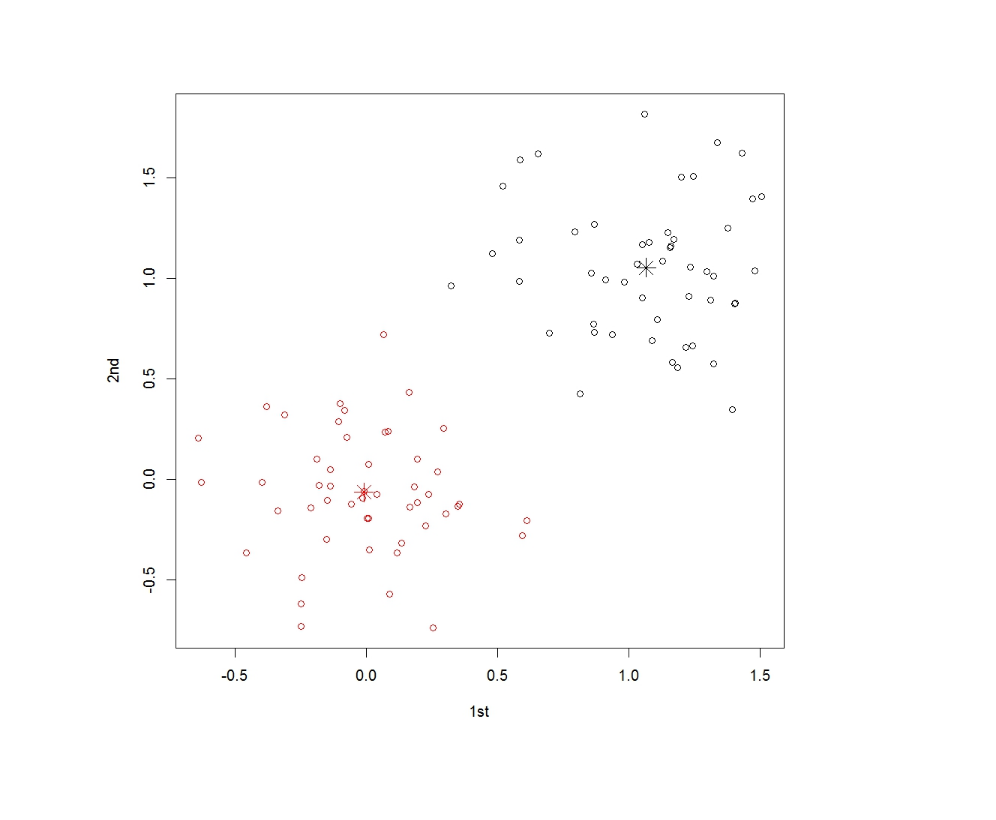
Example result
- The following is the result of kmeans to group two clusters from auto-generated data.