Hierarchical clustering
Hierarchical clustering in R
getOriData <- matrix( c(
dim1 = rnorm(30,mean=100,sd=5),
dim2 = cos(rnorm(30,mean=200,sd=100)),
dim3 = sin(rnorm(30,mean=500,sd=300)),
dim4 = sample(c(-100:100,NA),size=30,replace=TRUE),
dim5 = sample(c(500:1000,NA),size=30,replace=TRUE)
),
ncol = 5
)
colnames(getOriData) <- c("dim1","dim2","dim3","dim4","dim5")
rowNameList <- c()
for(i in 1:nrow(getOriData)) {
rowNameList <- c(rowNameList,paste("data",toString(i),sep=""))
}
rownames(getOriData) <- rowNameList
getOriData[is.na(getOriData)] <- 0
clusTree <- as.dist(1 - cor(t(getOriData)))
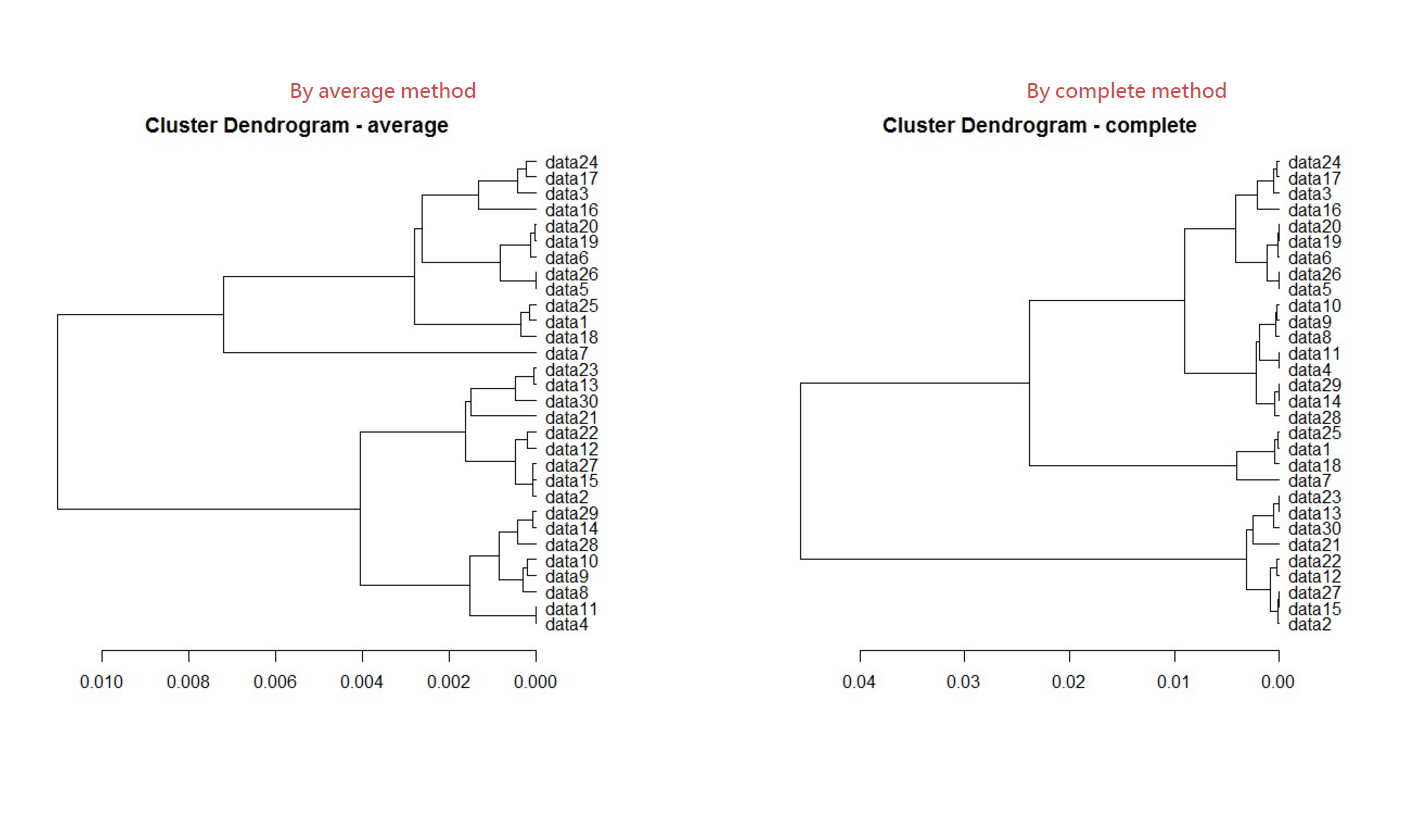
hc_ave <- hclust(clusTree, "average")
hc_cmp <- hclust(clusTree, "complete")
par(mar=c(3,1,1,3))
plot(
as.dendrogram(hc_ave), labels = NULL,
axes = TRUE, frame.plot = FALSE, ann = TRUE,
main = "Cluster Dendrogram - average",
sub = NULL, cex = .6, horiz=T
)
par(mar=c(3,1,1,3))
plot(
as.dendrogram(hc_cmp), labels = NULL,
axes = TRUE, frame.plot = FALSE, ann = TRUE,
main = "Cluster Dendrogram - complete",
sub = NULL, cex = .6, horiz=T
)
getSubtreeGroup <- cutree( hc_ave, k=15 )
getSubtreeHeight <- cutree( hc_ave, h=0.007 )
Example result
- The following is the result of hierarchical clustering to group as tree-typed format from auto-generated data.